Servoyant Version 6.0 Features
Changes to Provisioning Policies
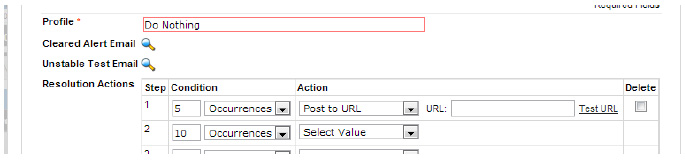
New Resolution Profile Action – Post to URL: This can be used to post alert specific data to a web site utilizing a URL. Some examples of uses for this include building SharePoint widgets, interfacing to automated dialers, etc…
Setup from Provisioning Policy:
- Resolutions - Resolution Profiles as resolution action. Applies to alerts created from tests.
- Assign Defaults - Alerts. For all internal alerts listed in that tab.
Available post parameters:(all parameters are URL encoded)
- accountname – Site name
- accountno – Site number
- machinename – Device name
- description – Device description
- devicetype – Device type
- ipaddress – Device IP
- testtime – Test time when alert was first generated
- status – Status text
- replytxt – Test reply text
- replyval – Test reply value
- lasttesttime – Last test time
- laststatus – Last test status
- lastreplytxt – Last test reply text
- eventlog – Event Log
- eventsource – Event source when alert was first generated
- eventid – Event ID when alert was first generated
- lasteventsource – Last event source
- lasteventid – Last event ID
- cleartime – Alert clear time
- counter – Alert occurence
- deviceid – Internal device ID
- testname – Full test name with target and description
- priority – Alert priority
Example
Post URL: http://admin.servoyant.com/test.php
Post Parameters:
accountname=Test+Site&accountno=123&machinename=TEST-DEVICE &description=Device+description&devicetype=Desktop&ipaddress=1.1.1.1&testtime=2013-11-01+13%3A50%3A04-07&status=Bad&replytxt=Not+Running&replyval=0&lasttesttime2013-11-01+13%3A54%3A04-07&laststatus=Ok&lastreplytxt=Running &eventlog=Application&eventsource=System&eventid=3&lasteventsource=System&lasteventid=3&cleartime=2013-11-01+13%3A55%3A04-07&counter=1&deviceid=123&testname=Status+Check&priority=Medium;
Returns: Fail/Success (If page was found or not).
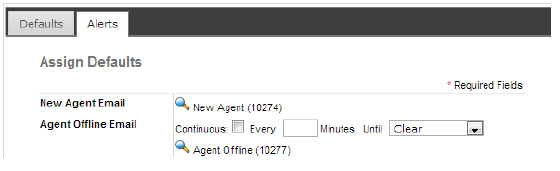
Agent Offline Alert, Continuous Option
Located under Assign Defaults|Alerts, you can now enable continuous notifications for offline alerts, including the frequency of notification and whether Ack/Clr will stop the notifications.
Granular Bidirectional Ticket Controls
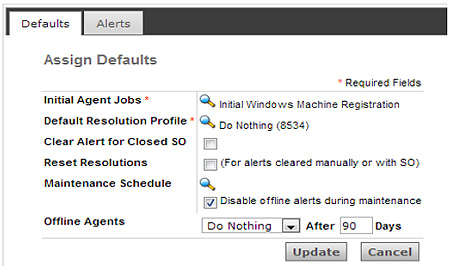
With the addition of the "Reset Resolutions" option, ticket behavior has been modified to close the loop on the bidirectional feed. If a ticket is closed on the ticketing and it is closed, you must enable the "Clear Alert for Closed SO" option so that the alert that corresponds to the ticket is cleared from Servoyant upon closure of the ticket. However, if you want the condition to re-arm and create a new ticket if the condition still violates the alerting threshold, you must enable the "Reset Resolutions".
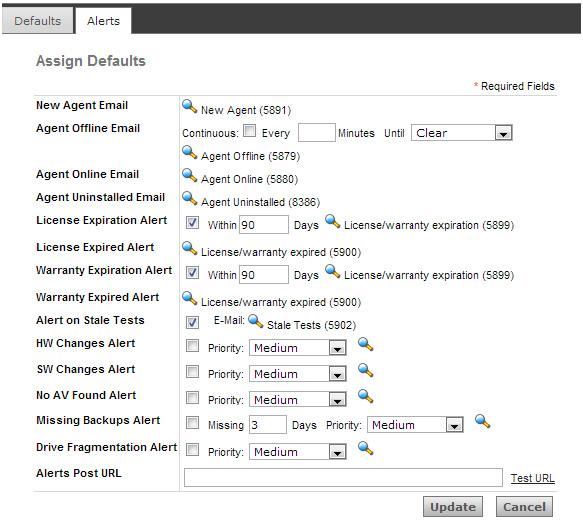
These are alerts that are not based on a test. They analyze data stored in the database and trigger alerts based on these events:
- Hardware Change
- Software Change
- No Antivirus installed
- Missing Backups
- Drive Fragmentation
Scheduled Patching
A new interface has been created to add more granular patching schedules. The new patching engine is decoupled from WSUS and does not require Servoyant's WSUS server for reporting. Everything is self-contained within the agent. To access this, go to the Schedules|Scheduled Patching tab in the policy.
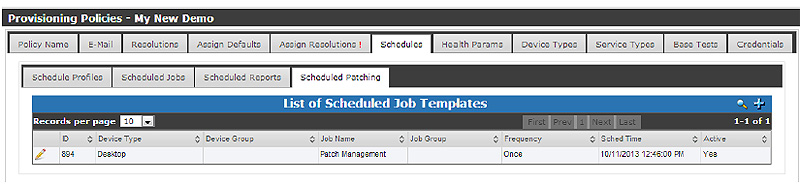
The blue + icon will launch the wizard, guiding you through the following screens:
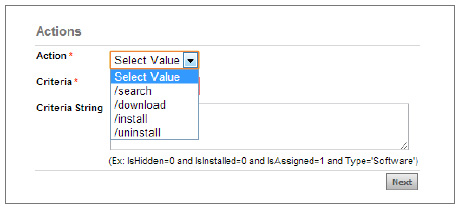
Use this option to schedule the action you want to perform: Search for available patches, Download patches, Install Patches, Uninstall patches. If you choose Install it will automatically download any needed files.
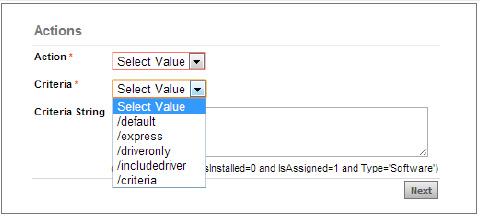
Use the following two fields to specify the search criteria for patches. Most commonly you will choose default or express.
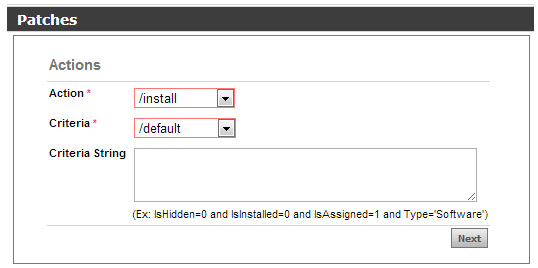
A completed first screen may look like this:
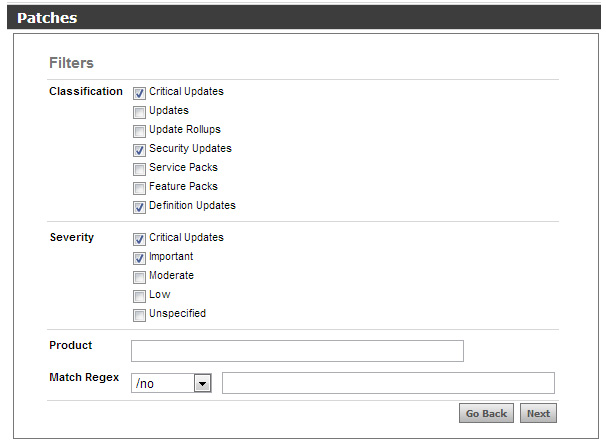
The next screen will allow you to granularly select patches based on classification and severity. Only the selected patches will be installed. You can also select a specific product such as Office 2013 (utilizes a "contains" match so a partial string will work.
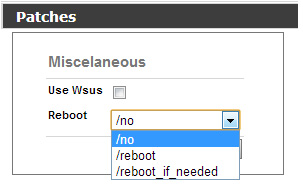
Once you have selected the desired patches, the next screen allows you to specify whether to utilize a defined WSUS server as well as different reboot options.
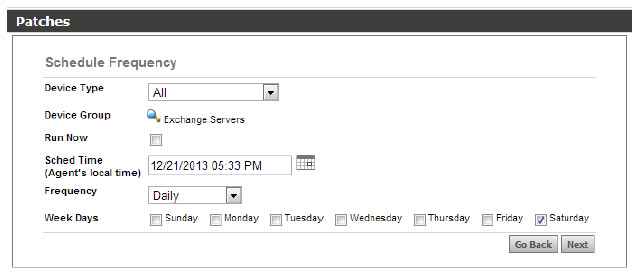
On the following screen you can specify the targets for patching based on device type or device group. You can also specify the schedule for the patching job.
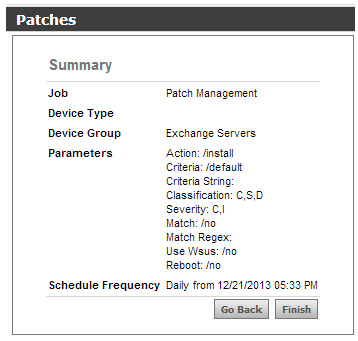
The final screen provides a summary and must be accepted before the job will be submitted.
This feature can also be accessed outside of the policy via Automate Patches. The same wizard will be presented. This allows you to schedule patching independent of the provisioning policy for specific sites, devices, or device groups.
Credentials
A credentials store has been added to make it easy to use stored credentials on tests and jobs.
Device Type RSP and Patch Removal
When unchecking the RC or LMI from the Device Types section of the policy as an indicated remote support provider for deployment, you will be presented with an option to uninstall the unchecked provider. The same option will be made available if you uncheck the Patches option. This will result in removal of the registry keys that control patching if Uninstall is checked.
New Job Features
Job Stagger: When scheduling a job against multiple devices, there is now an option to stagger jobs. When activated by targeting multiple devices, you will see this new option in the job scheduling window.
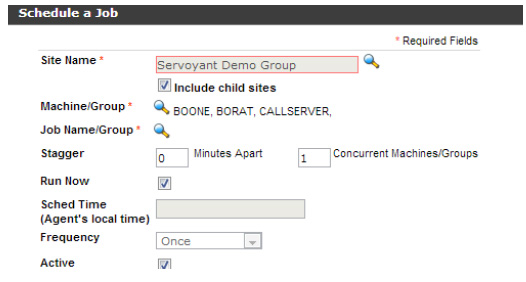
Enter how many minutes apart each group of machines will run and how many concurrent machines will run in each job pass. For example, if there are 30 machine targeted and you tell it to space them 5 minutes apart and run 3 concurrent machine, the total execution time will consist of 10 groups, spaced 5 minutes apart, so it will take approximately 50 minutes to complete. The advantage is that this will reduce network load for jobs that require network file resources such as patching or software installation jobs.
Run Out of Schedule: If a machine is offline when a scheduled job is supposed to run (one with a specific execution date and time), you can force the job to run when the machine comes back online. Currently the behavior is that if the device comes back online more than 15 minutes beyond the scheduled time, the job will not run. By setting the "Run Out of Schedule" option, you can force the job to run at reboot.
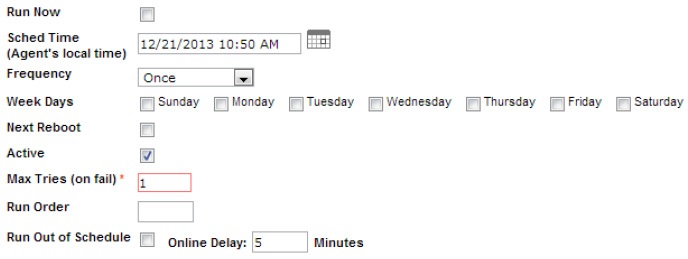
Enable "Run Out of Schedule" by activating the checkbox and then indicate how many minutes to wait after the machine comes back online in order to fire off the scheduled job.
Virtualization Dashboard
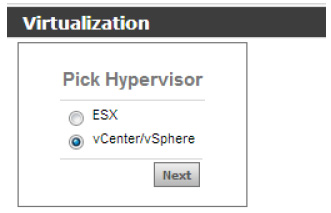
With this release we have added a wizard to simplify the setup and monitoring of VMWare environments (Hyper-V hosts will appear and Xen will come in a future release). Make the site where the VMware environment exists the active site and then click on Monitor|Virtualization. Select the blue + icon to start the set up wizard (the tooltip hover will say "Run Provisioning".
After clicking the blue + icon, you will be presented with the option to pick your hypervisor. Right now the only two choices are ESX and vCenter/vSphere. Choose the correct hypervisor for the environment you wish to monitor.
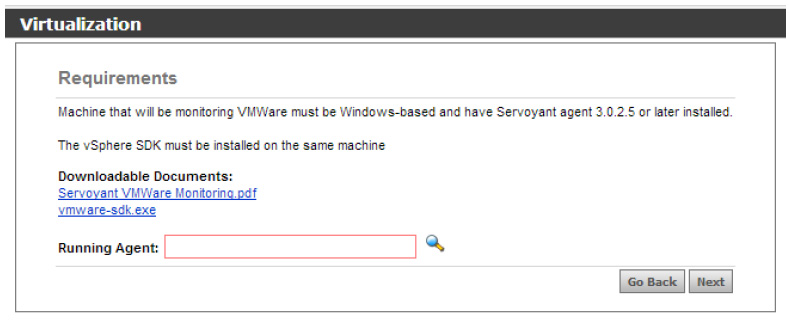
After selecting the hypervisor, you will be prompted with the system requirements to monitor VMWare. Download and install the SDK if necessary from the link on this page if necessary. You should have already updated the agent that will be monitoring VMware as per the instructions at the beginning of this document.
Choose the agent that will be monitoring the VMWare environment by using the picker in the Running Agent field.
On the next screen you will be prompted to enter the name of the ESX host or vCenter environment to be monitored. If there are multiple servers managed via vCenter or vSphere, enter the name or IP of the management server.
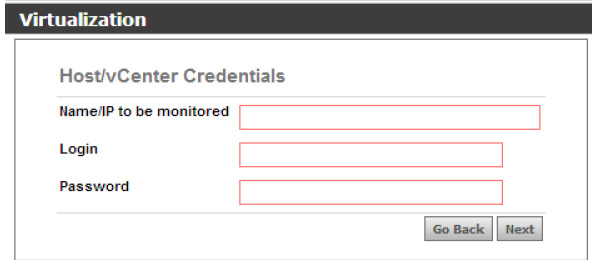
For ESX, enter root level credentials for the host. If it is a vCenter management server, enter the appropriate credentials to access vCenter.
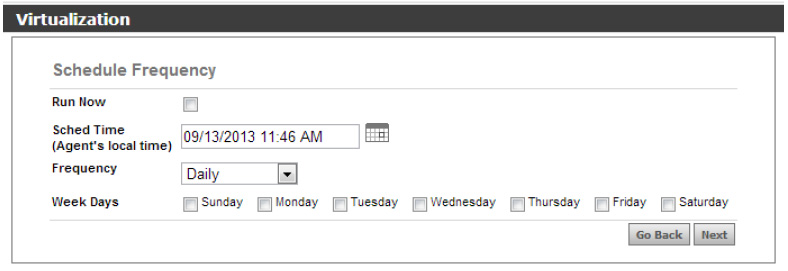
Part of the new wizard is that it allows you to schedule this either as a one-time job or a recurring job, using the same basic methodology as scheduling a normal job in Servoyant.
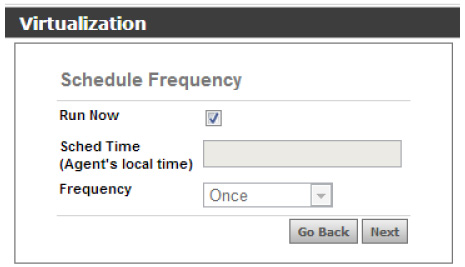
By default, the Run Now checkbox will be selected, which will force the job to run immediately once it is submitted. It will not run again until you go through this process and reschedule it. Alternatively, you can uncheck the box and enter a specific time and frequency for the tasks to run, keeping the VMware monitoring complete, accurate, and up to date.
The final part of the wizard provides a summary of what will be performed. Review these options and then select the final setting for test provisioning. You have the choice of either allowing Servoyant to handle all the discovery and provisioning automatically (meaning that all discovered devices and tests are automatically created), or you can select a manual review, where everything gets enumerated and listed for your review, and you can then select what you wish to monitor.
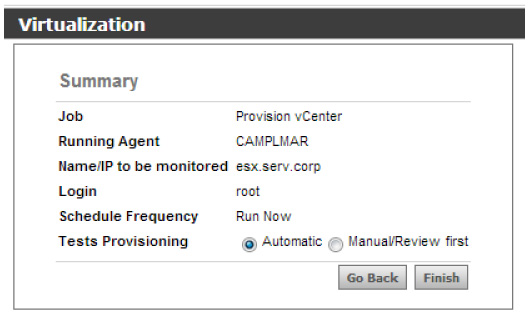
Once you click finish, all the necessary jobs will be run and/or scheduled and all provisioning will occur.
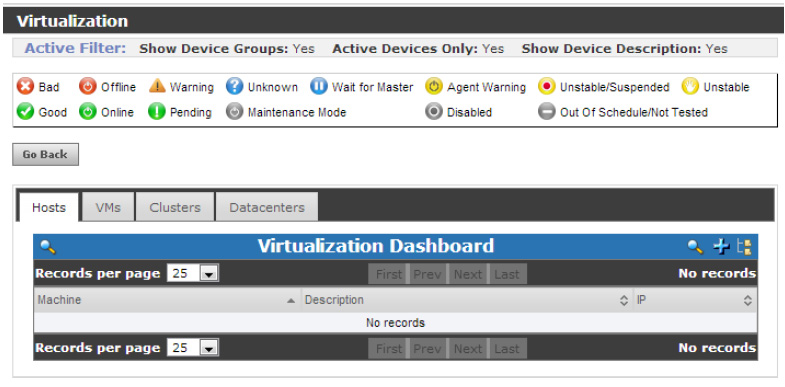
Once the virtual environment has been provisioned and data is coming in, Servoyant will automatically populate the Virtualization Dashboard, available under Monitor|Virtualization. Once populated the dashboard will appear as follows:
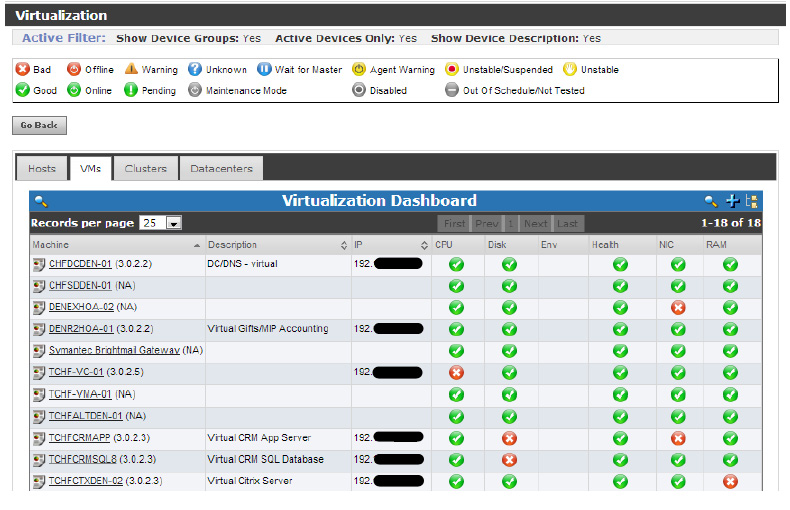
From this view you can view the overall health of the environment with the same drilldown capabilities as in the regular dashboard. This includes the ability to drill into the details of tests results for each category of test. This includes health status checks of the VM environment such as storage health, chassis health, etc…
All the elements of the VM environment will be broken out into tabs – Hosts, VMs, Clusters, and Datacenters.
Drilling down in to a specific device is accomplished by clicking on the device name link. In the case of a virtual machine, the machine name link will open the regular device dashboard based on the telemetry reported by the locally installed agent, while the report icon to the left will display a device dashboard based on the telemetry reported by the hypervisor. Clicking on it will generate a screen similar to this one below.
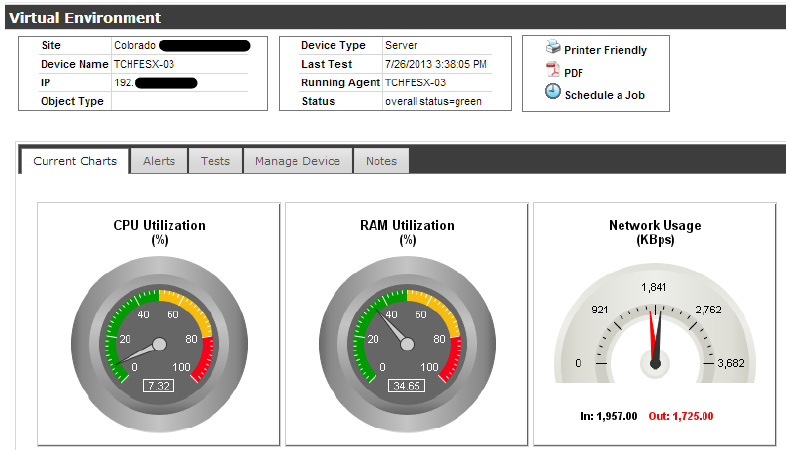
The individual gauges in this view can be clicked in order to reveal historical performance information. Different gauges will be presented depending on the type of device.
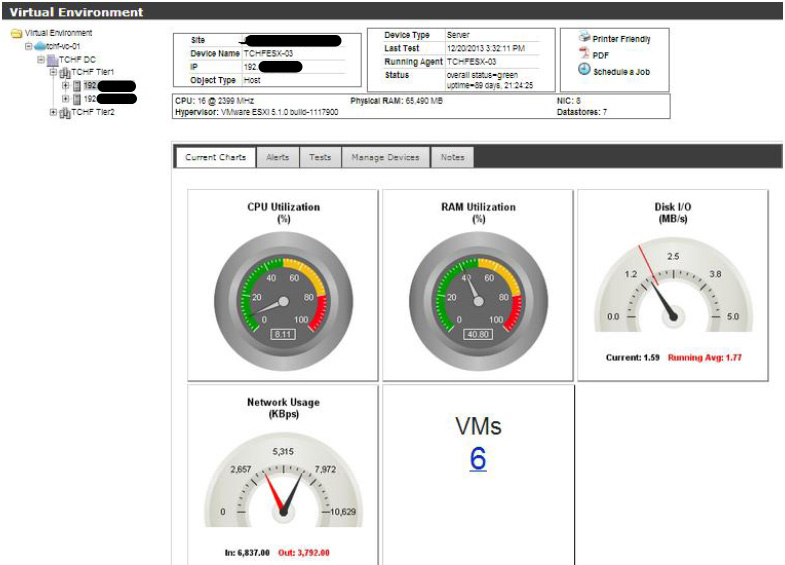
Clicking on the ![]() icon on the toolbar of the virtualization dashboard (located just to the right of the search option) will display a dynamic, fully populated tree, identical to what was discovered during the enumeration process. The tree is full expandable and will display the logical hierarchy of the virtual environment. As you navigate the tree and click on object, the right side of the pane will update and show data specific to the selected device. The screen will be similar to the one below.
icon on the toolbar of the virtualization dashboard (located just to the right of the search option) will display a dynamic, fully populated tree, identical to what was discovered during the enumeration process. The tree is full expandable and will display the logical hierarchy of the virtual environment. As you navigate the tree and click on object, the right side of the pane will update and show data specific to the selected device. The screen will be similar to the one below.
Notes
- At this point, thresholds have not been added to the tests.
- Provisioning policies will need to be updated to assign resolution profiles to VM tests.
- There is a credential store in the policy for each site that will allow you to enter credentials that can be reused.
- It is possible for overloaded vCenter servers, especially those on a VM themselves, to take up to 3 seconds to respond to each query. If that is the case, the test cycle will likely not complete every 5 minutes. Our recommendation in this scenario is to configure an external agent, not the actual vcenter server, to handle the vcenter monitoring tests.
Security Features
Servoyant 6.0 adds several highly requested features to improve user security. These include:
- Verification of password strength
- Password expiration intervals
- Session Idle Timeout
These setting are configured under the Login Defaults section of the user setup, as shown below.
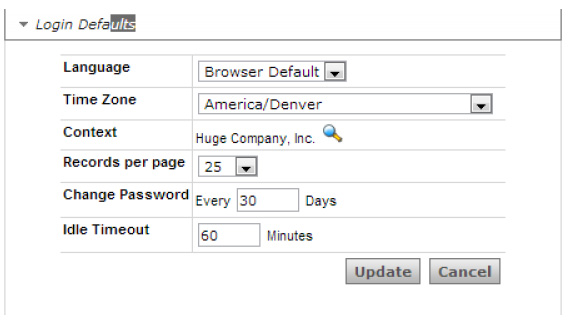
To set the idle timeout to never expire, set the value to 0 minutes. The defaults are password refresh every 30 days and a 60 minute idle timeout.
Client Portal
Another new option designed to facilitate limited end user access to Servoyant is the Client Portal. Users can be set up as client portal only users, which has limited, predefined access to inventory reports and remote access, if enabled, to the list of visible devices for the user. To set up a user for Client Portal access, edit the user account and click on the Client Portal checkbox. Notice that all security role options disappear at this point. Select which remote support provider, or Primary RC, will be made available to the user (or all).
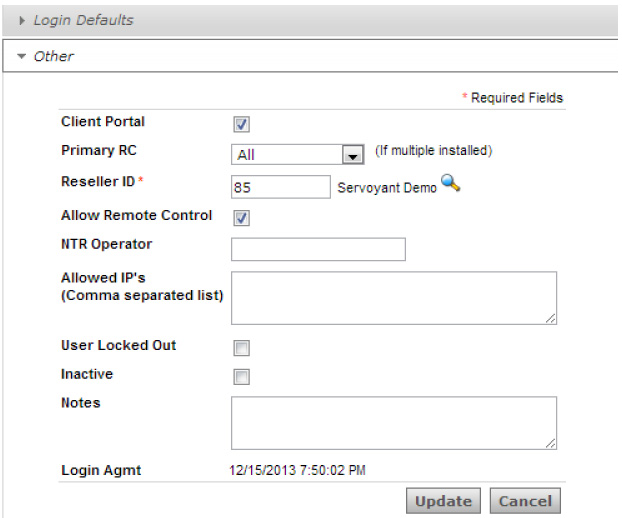
Be sure to enable "Allow Remote Control" if you want to make that feature available. This works in conjunction with the Primary RC option to present the desired connection methods to the user.
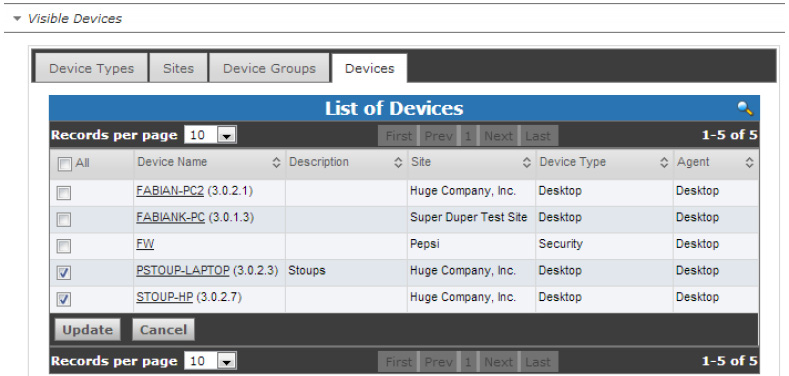
Limiting access to specific devices is accomplished via the Visible Devices section of the user setup. Simply enable access to the sites, groups, device types, or specific devices you want to make available.
Access to the client portal is through http://admin.servoyant.com. Once the user enters his or her credentials, the proper view will be loaded, branded as defined in the site setup, as follows:
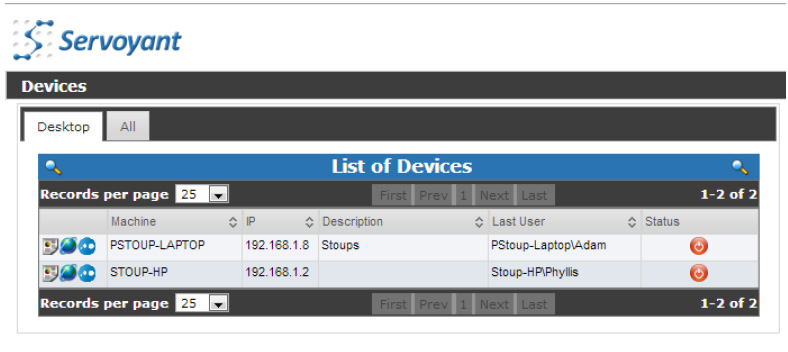
Simply click on the report, RC, or LMI icons to view inventory details or connect to the device.
New Jobs
Numerous new Community jobs to handle specific removal of patches have been added, specifically for KB2837618.
Additional system jobs include:
- Fix 2837618
- Patch Management
- Refresh System Scripts
- Query Internet Explorer Properties
- Enumerate vCenter
- Provision vCenter
- New Tests
All of the VMWare and Xen tests:
- CISCO ADSL SNMP test
- Palo Alto SNMP tests
- Eaton UPS SNMP tests
- Database - MS SQL Server – Version, Database Size
- Database - MySQL Server – Version, Database Size, Threads Connected
- Database - Postgres – Total Backends
Java Management Extensions - Servoyant can now execute JMX tests for monitoring Java apps.
New Reports
A new trap report has been added under Reports|Alerts|Trap Alerts. This is a security centric report that categorizes each received trap based on severity and shows a gra[h with the occurrence of security issues by severity, by device.
Other New Features/Fixes:
- System Messages can now be acknowledged and will no longer be displayed/scrolled once that action has been taken.
- The Tigerpaw Agent now synchronizes wildcard entries on standardized brief descriptions i.e. Antivirus Support – Bill Smith.
- Site name has been added to the subject of scheduled report emails.
- Notes tabs have been added to site and device views so you can track an unlimited number of date/time stamped entries related to each object.
- Data table of Last Test Results now has export data option.
- Single click patch installation and removal is available from the patch grid in Systems Dashboard and from Reports|Management|Patch Details.