![]()
Dashboards and Reports
My NOC needs to know where to focus their efforts, and I need to know how the system is behaving so I can avoid problems in the future.
If you are like most IT professionals today, you need to be a master of one thing - multitasking. Between end users, vendors, carriers, etc...
Dashboards
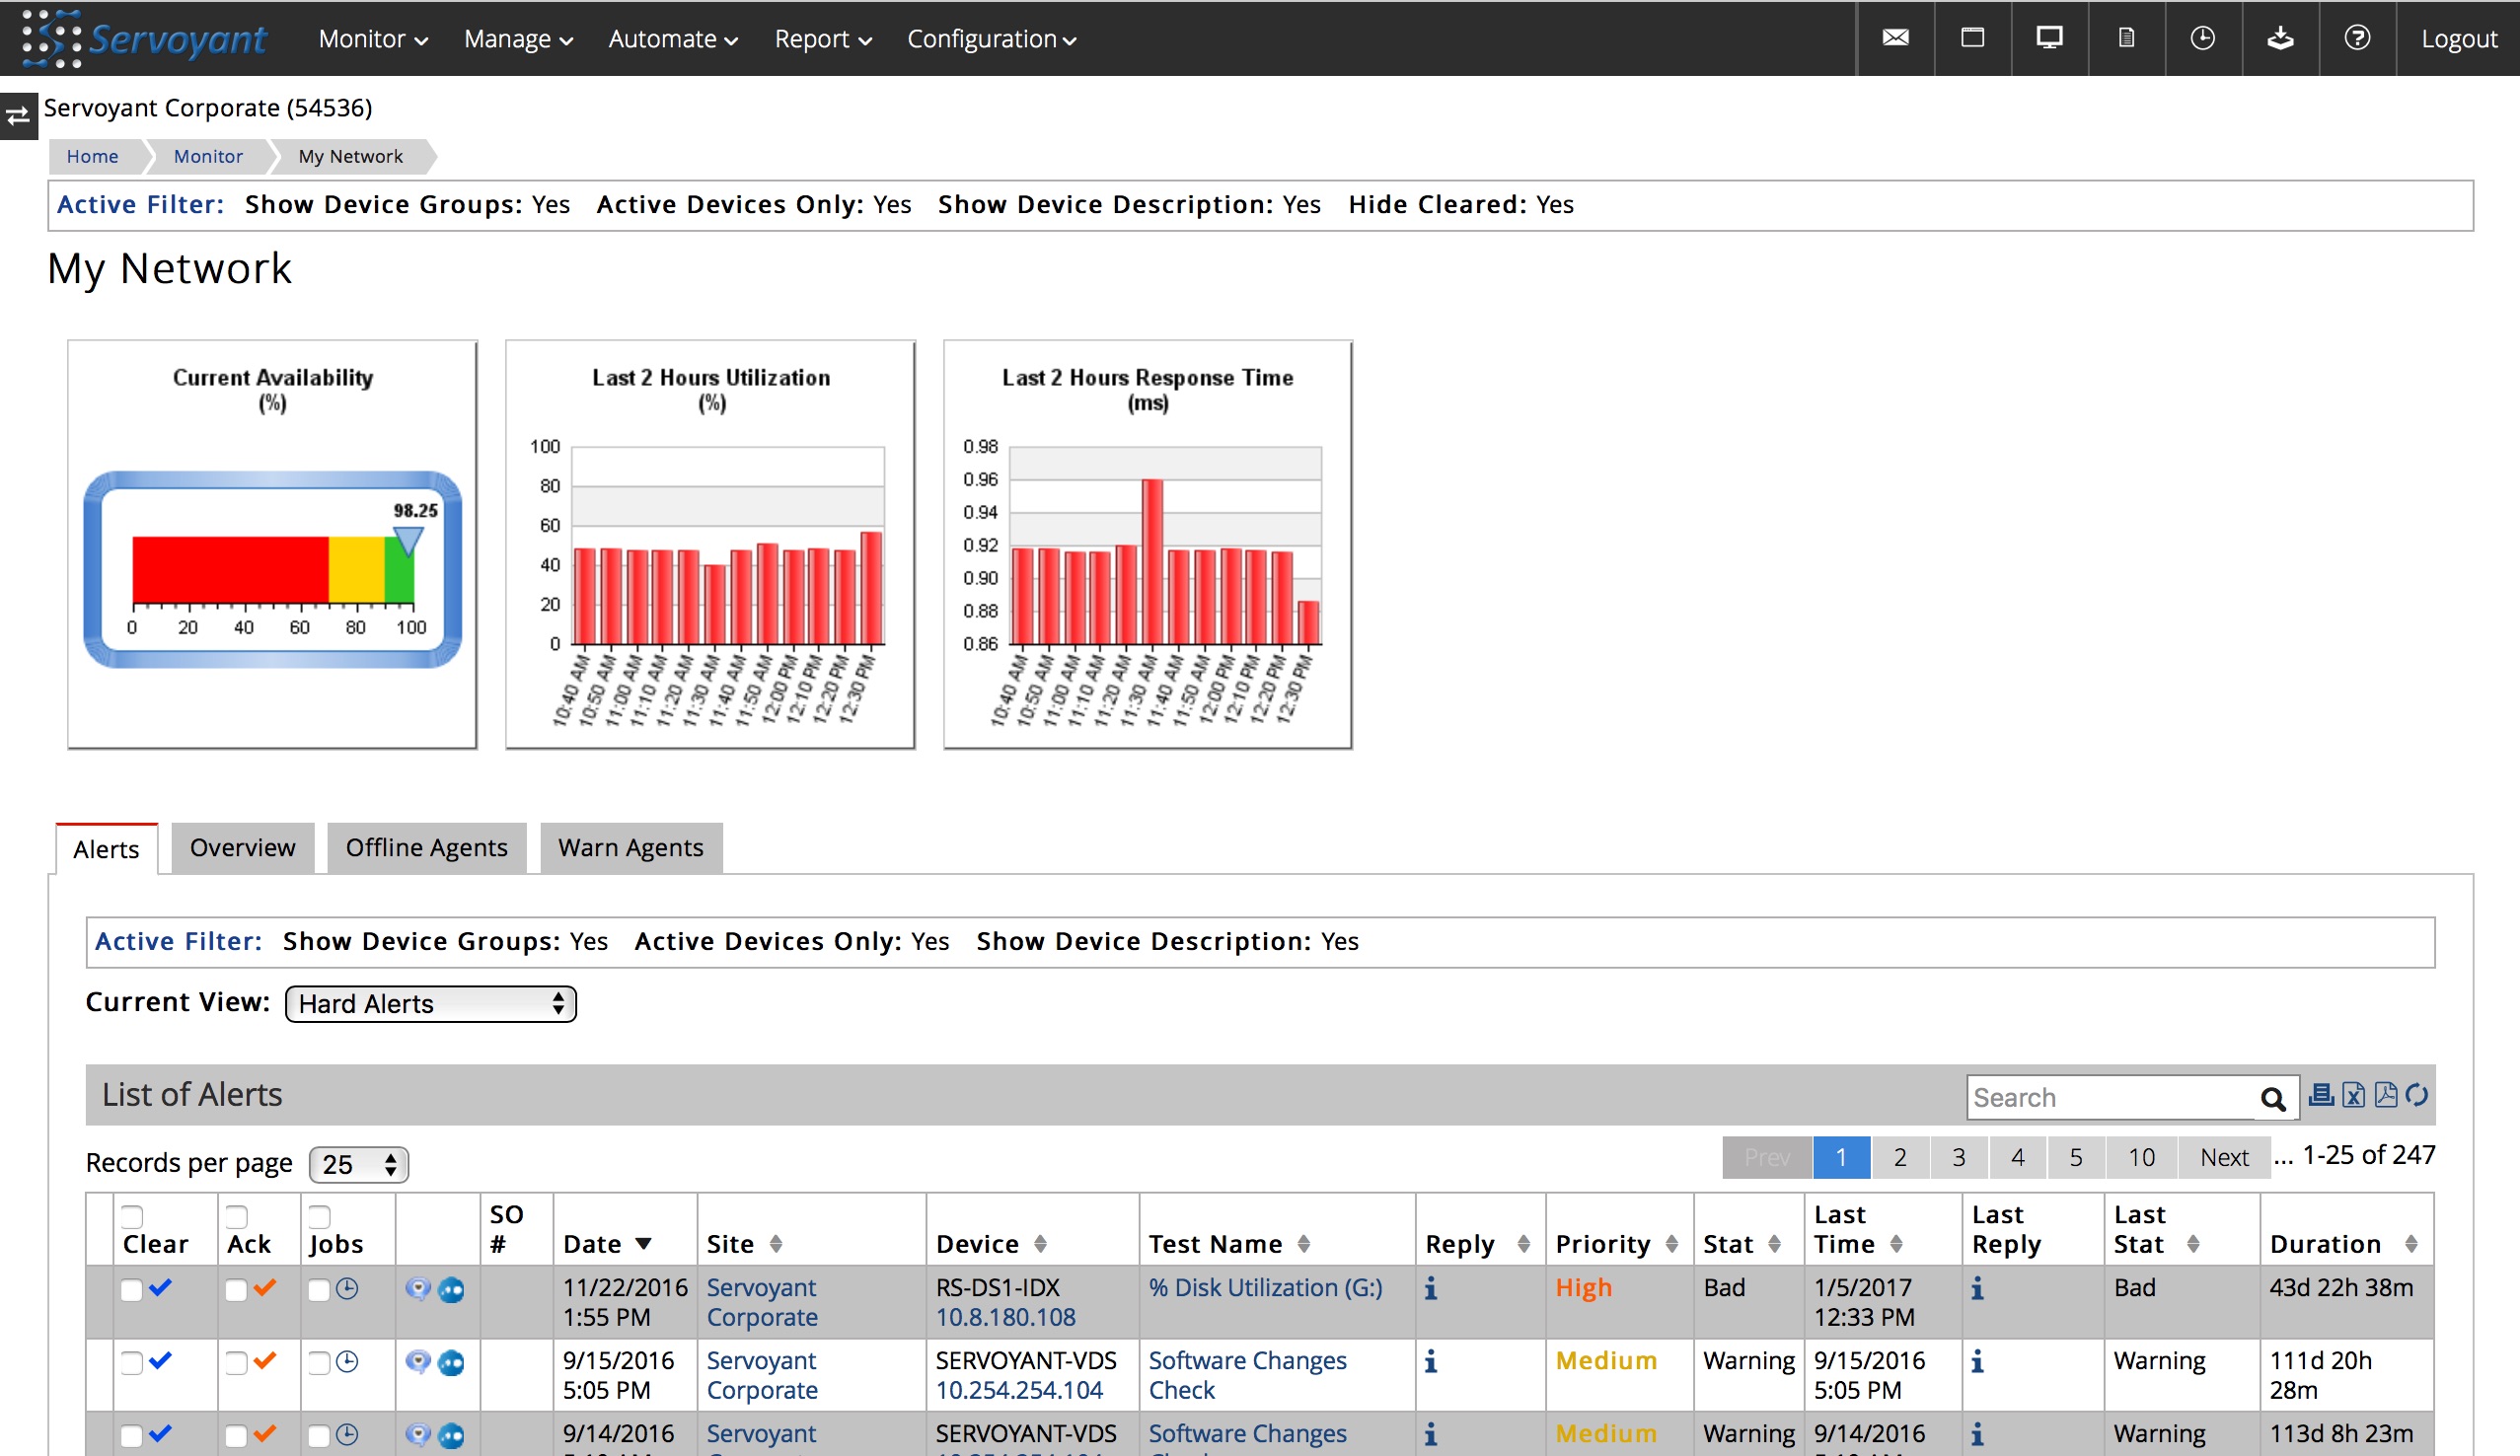
 With a rich web interface and optimized dashboards, you and your team can stay on top of everything that is going on with the devices and applications you support. All dashboards are generated dynamically to keep you informed on all monitored activity. Some of the dashboards available in Servoyant include:
- High level dashboards summarizing infrastructure availability, response time and utilization
- Tactical alert views pinpointing actionable items
- System dashboard providing iconic indicators of device conditions
- Device specific dashboards giving you drill down and deep-dive capabilities
- Application specific dashboards
- Backup monitoring dashboards supporting many industry standard products
- Tactical Dashboards that show alerts, device status, key network indicators.
The dashboards can be filtered are fully searchable and sortable, giving you the ability to focus in on the information you need. Filter by site, device group, device name, device type, user name, and more...
 Take action directly from dashboard:
- Drilldown into details for analysis
- Schedule a job
- Remote into a device
- Look up KB or other pertinent information
- View historical trends
- Manage services and processes
Device Specific Dashboards
Once you have isolated key devices, drill down into device specific views specifically built for servers, desktops, routers, switches, firewalls, and more. Get the information you need from one screen. The level of detail is extensive, including:
- Current performance charts
- Hardware details
- Installed software
- Warranty information
- Job history
- Running services
- Running processes
- Interfaces
- Running test list